Portfolio
Click below to see examples of our work
Data Infographics
Turn you webpage, white paper or article into a stunning Infographic. Examples here
Process Explainer Infographics
Turn your process or service into a easy to read Infographic for that next client. Examples here
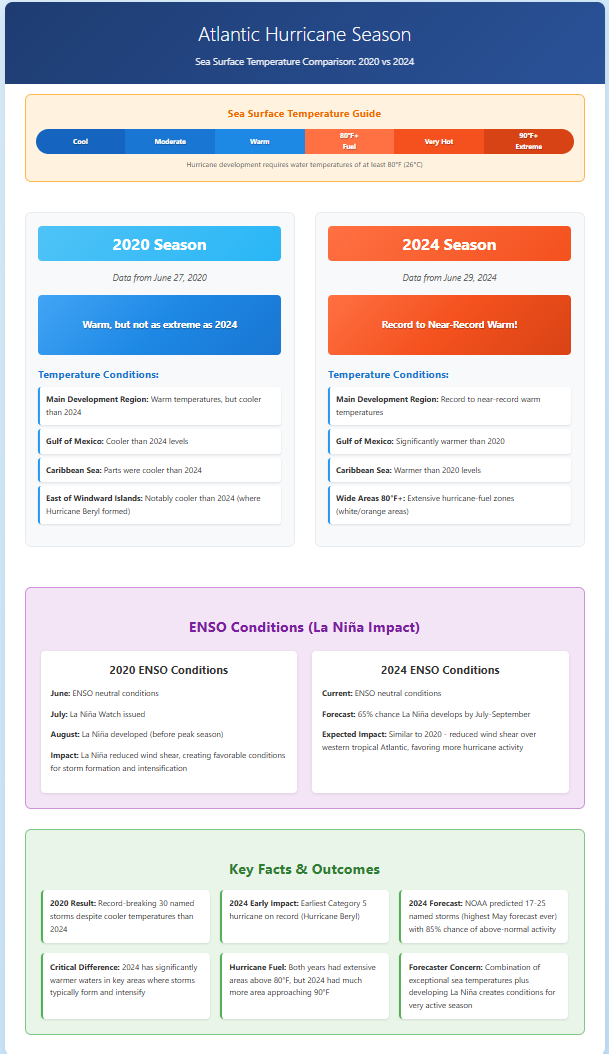
Comparison Infographics
Comparison Infographics transform your raw numbers into sleek, interactive HTML visuals that engage your audience and drive decisions. Examples here
Data Infographic Examples
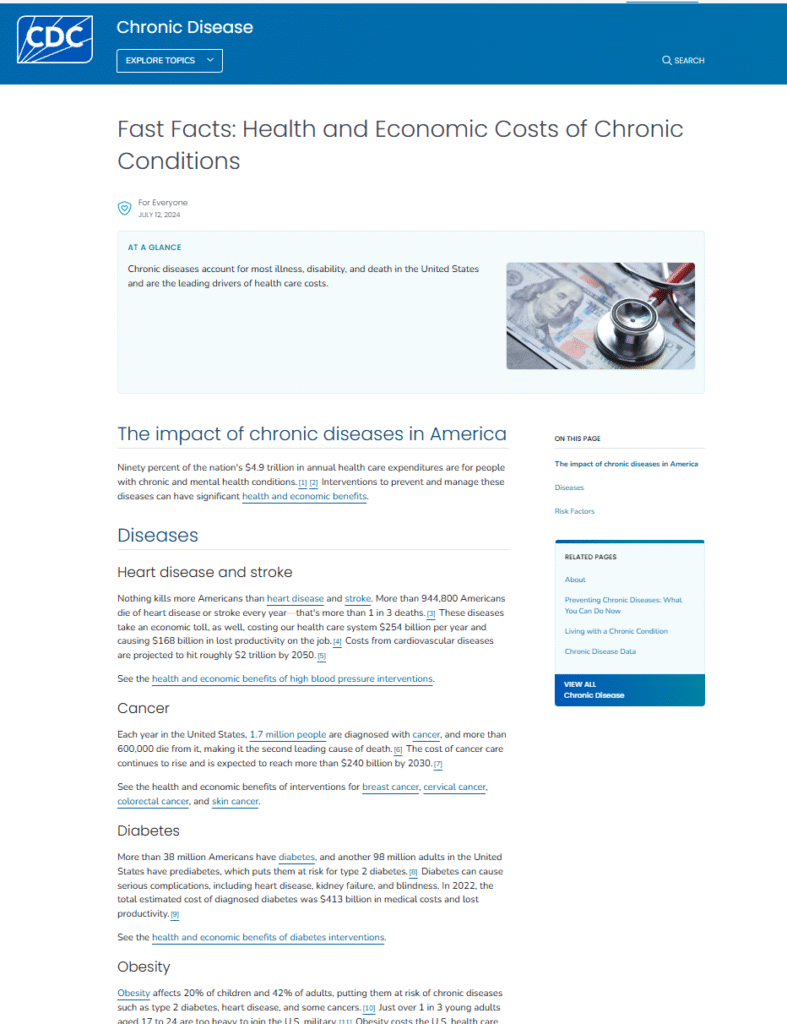
Original Webpage CDC Chronic Disease Prevention Link To Website
After Conch C Designs reviewed it, extracted and transformed the data from this public domain webpage, you can see how much easier and cleaner the information is for the reader.
The first example is of a static infographic image, these are great for emails and digital freebies to build your mailing list
The second is an infographic with a data summary and interactive boxes for the reader to learn more about each topic.
These are engaging and keep readers on your webpage.
Example 1 Static Infographic Image
Example 2 Static Infographic with Hover Boxes HTML
The Big Four Risk Factors
Four modifiable risk factors account for most chronic diseases in America. Your power to prevent illness and save lives starts with these evidence-based actions.
Quit Smoking
- Call 1-800-QUIT-NOW for free support
- Use nicotine replacement therapy
- Join a smoking cessation program
- Ask your doctor about prescription aids
Get Active
- Take brisk 30-minute walks 5 days/week
- Use stairs instead of elevators
- Try strength training 2 days/week
- Find activities you enjoy
Eat Smart
- Fill half your plate with vegetables
- Choose whole grains over refined
- Limit processed and red meat
- Reduce sodium to <2,300mg daily
Drink Responsibly
- Track your daily alcohol intake
- Choose alcohol-free days each week
- Use smaller glasses and pour less
- Seek help if you can’t cut back
Your Prevention Power Starts Today
Small changes in these four areas create massive health improvements. Choose one action step and start your prevention journey now.
Example 3 Summary Data with Interactive Boxes Infographic HTML (click the boxes with the + sign for more information)
CDC Chronic Disease Prevention
Executive Summary
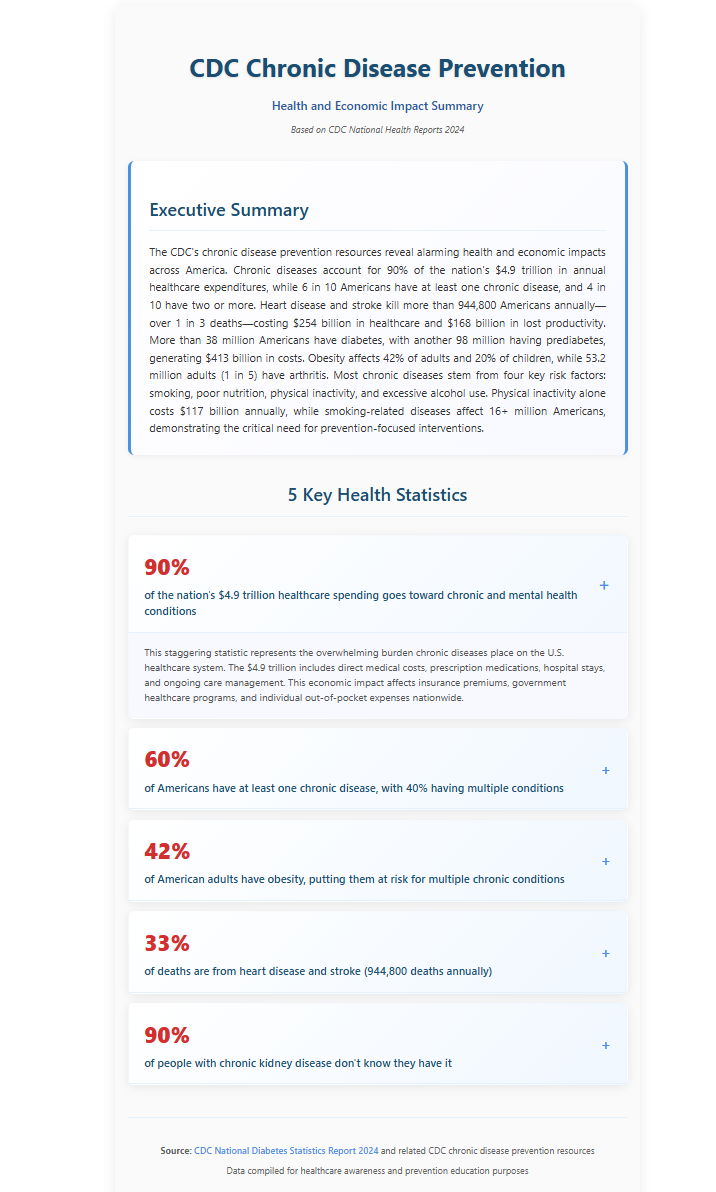
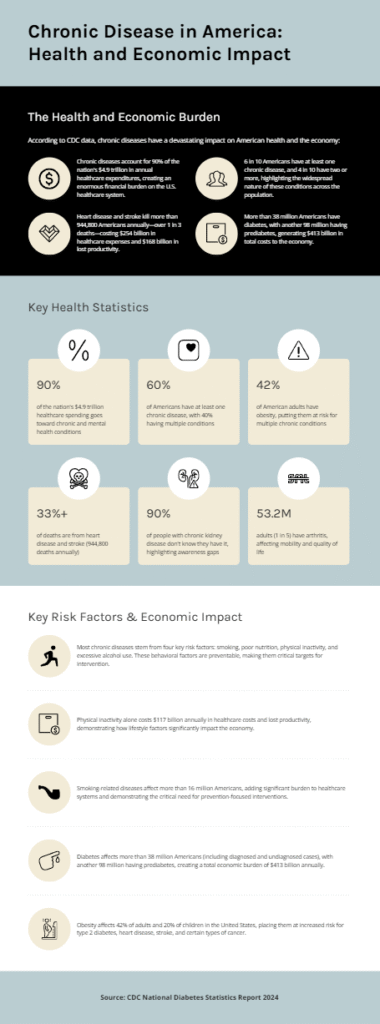
The CDC’s chronic disease prevention resources reveal alarming health and economic impacts across America. Chronic diseases account for 90% of the nation’s $4.9 trillion in annual healthcare expenditures, while 6 in 10 Americans have at least one chronic disease, and 4 in 10 have two or more. Heart disease and stroke kill more than 944,800 Americans annually—over 1 in 3 deaths—costing $254 billion in healthcare and $168 billion in lost productivity. More than 38 million Americans have diabetes, with another 98 million having prediabetes, generating $413 billion in costs. Obesity affects 42% of adults and 20% of children, while 53.2 million adults (1 in 5) have arthritis. Most chronic diseases stem from four key risk factors: smoking, poor nutrition, physical inactivity, and excessive alcohol use. Physical inactivity alone costs $117 billion annually, while smoking-related diseases affect 16+ million Americans, demonstrating the critical need for prevention-focused interventions.
5 Key Health Statistics
-
90% of the nation’s $4.9 trillion healthcare spending goes toward chronic and mental health conditionsThis staggering statistic represents the overwhelming burden chronic diseases place on the U.S. healthcare system. The $4.9 trillion includes direct medical costs, prescription medications, hospital stays, and ongoing care management. This economic impact affects insurance premiums, government healthcare programs, and individual out-of-pocket expenses nationwide.
-
60% of Americans have at least one chronic disease, with 40% having multiple conditionsChronic diseases include conditions like diabetes, heart disease, stroke, cancer, chronic kidney disease, and arthritis. The high prevalence of multiple conditions (comorbidities) significantly complicates treatment plans, increases healthcare costs, and reduces quality of life for millions of Americans.
-
42% of American adults have obesity, putting them at risk for multiple chronic conditionsObesity significantly increases the risk of developing type 2 diabetes, heart disease, stroke, sleep apnea, and certain types of cancer. Additionally, 20% of children are affected by obesity, creating long-term health challenges that often persist into adulthood and contribute to rising healthcare costs.
-
33% of deaths are from heart disease and stroke (944,800 deaths annually)Heart disease and stroke remain the leading causes of death in the United States. Beyond the tragic loss of life, these conditions cost $254 billion in healthcare expenses and $168 billion in lost productivity annually, affecting families, communities, and the economy nationwide.
-
90% of people with chronic kidney disease don’t know they have itChronic kidney disease often develops silently without noticeable symptoms in early stages. This lack of awareness leads to delayed treatment, progression to kidney failure, and the need for dialysis or transplantation. Early detection through routine screening could prevent many cases from advancing to end-stage kidney disease.
Process Explainer Infographics
Original Webpage of the National Library of Medicine’s PubMed Central website on Intermittent Fasting. Link To Website
These examples show how large amounts of data can be accentuated by a process explainer infographic.
Conch C Designs takes your data and transforms it into an easy to read process visual so the reader knows the high level steps without having to hunt through the website data.
Use it alone or to complement an article or blog.
The first example is of a static infographic and the second, an infographic with summary and interactive boxes for the reader to learn more about each of the 5 key health statistics.
Example 1 Static Infographic Image
Example 2 Interactive Infographic HTML
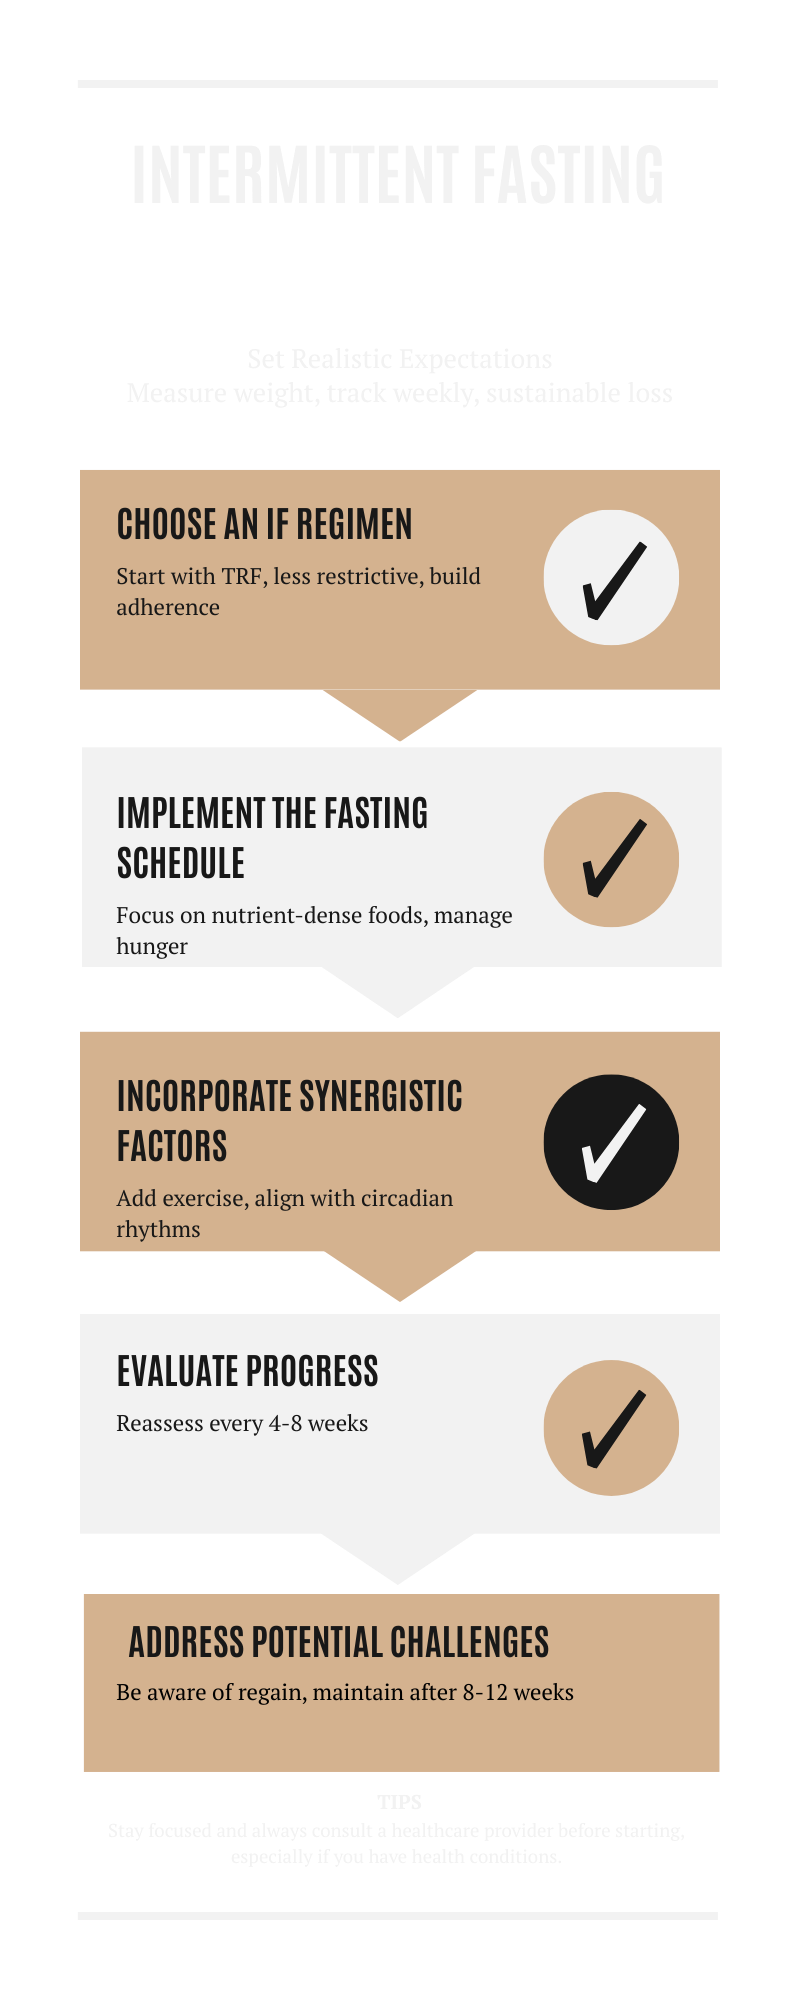
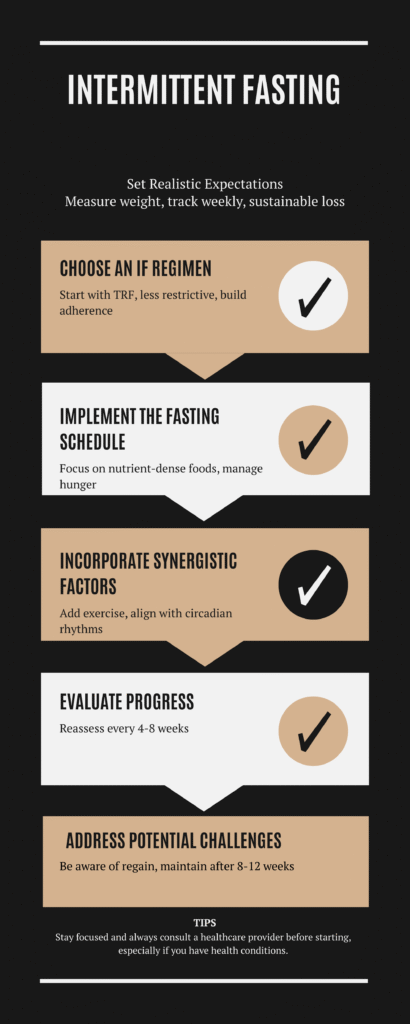
Intermittent Fasting
Your Complete Guide to Effective Weight Management